Premium のトップ10機能
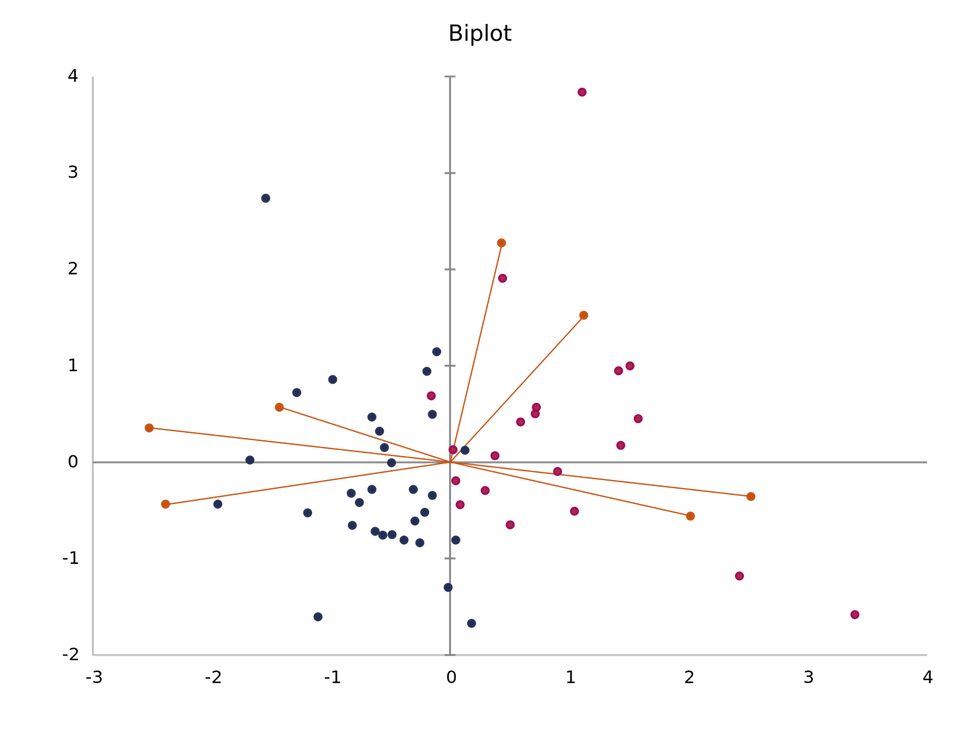
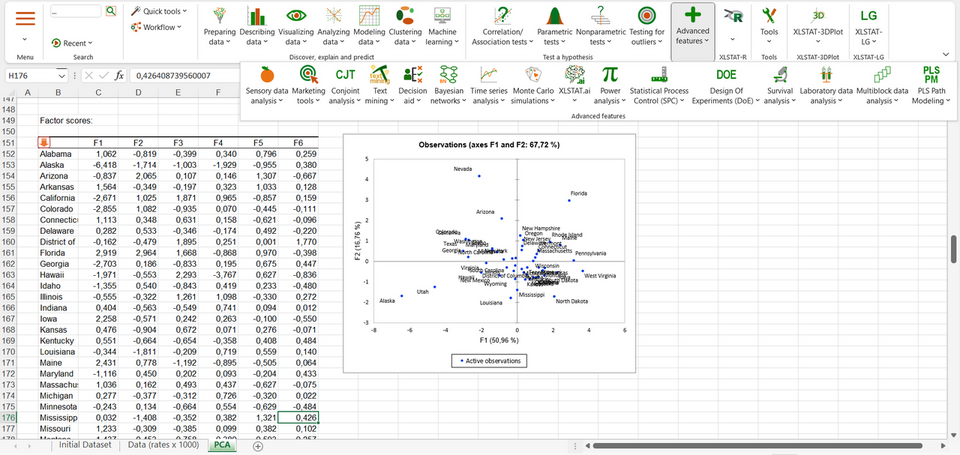
ANOVA (分散分析)、記述統計(箱ひげ図、散布図を含む)、線形回帰、主成分分析 (PCA)、Mann-Kendall傾向検定、相関検定、時系列の均質性検定、ペナルティ分析、ARIMA、カプラン・マイヤー分析

その他の機能
XLSTAT Premiumでは、XLSTAT Basic、XLSTAT Basic+ の各機能をはじめ、XLSTATの全機能を使用することができます。
- Sensory data analysis
- Preference Mapping (PREFMAP)
- Internal preference mapping
- Penalty analysis
- Product characterization
- Panel analysis
- CATA data analysis
- Temporal Dominance of
- Sensations (TDS)
- Time-Intensity
- Generalized Bradley-Terry model
- Sensory shelf life analysis
- Design of experiments for
sensory discrimination tests - Sensory discrimination tests
- DOE for sensory data analysis
- Generalized Procrustes Analysis (GPA)
- CLUSTATIS
- STATIS
- TCATA
- CATATIS
- Sensory wheel
- Free sorting data analysis
- CLUSCATA
- Projective mapping data analysis
- Liking data analysis
- Power for sensory discrimination
tests
- Path modeling (only for Windows OS)
- PLS path modelling
- Regularized generalized canonical
correlation analysis (RGCCA) - Generalized structured
component analysis (GSCA)
- Power analysis
- Statistical power for mean
comparison - Statistical power to compare variances
- Statistical power for proportion
comparison - Statistical power for linear regression
- Statistical power for ANOVA / ANCOVA
/ Repeated measures ANOVA - Statistical power for logistic regression
- Statistical power for Cox model
- Sample size for clinical trials
- Statistical power for correlation
comparison
- Statistical power for mean
- Design of experiments
- Screening designs
- Analysis of a screening design
- Surface response designs
- Analysis of a surface response
design - Analysis of a mixture design
- Taguchi designs
- Analysis of a Taguchi design
- Mixture designs
- Survival analysis
- Life table analysis
- Kaplan-Meier analysis
- Cox proportional hazards models
- Proportional Hazards model
with interval censored data - Sensitivity and specificity analysis
- ROC curves
- Nelson-Aalen analysis
- Cumulative incidence
- Parametric survival regression
(Weibull model) - Parametric survival curves
- Propensity score matching
- Illness-Death model
- Method validation
- Method comparison (Bland Altman, …)
- Passing and Bablok regression
- Deming regression
- Youden plots
- Dose effect analysis
- Dose effect analysis
- Four/Five-parameter parallel
lines logistic regression - Inter-laboratory proficiency testing
- OMICS data analysis
- Differential expression
- Heat map
- Marketing tools
- Sample size calculator
- Price sensitivity meter (Van
Westendorp) - Price elasticity of demand
- Customer lifetime value (CLV)
- Raking survey data
- Customer long-term value (CLTV)
- TURF analysis
- Conjoint analysis
- Designs for conjoint analysis
- Conjoint analysis
- Designs for choice-based conjoint
analysis - Choice based conjoint analysis
- MaxDiff analysis
- MONANOVA - Monotone regression
- Conditional logit model
- Conjoint analysis simulation tool
- Market generator
- Designs for MaxDiff
- Multiblock data analysis
- Canonical correspondence analysis (CCA and partial CCA)
- Canonical correlation analysis (CCorA)
- Redundancy analysis (RDA)
- Multiple factor analysis (MFA)
- Decision aid
- ELECTRE methods
- Design of experiments for the analytic hierarchy process (DHP)
- Analytic hierarchy process (AHP)
- Decision trees
- Bayesian networks
- Text mining
- Feature extraction
- Latent semantic analysis (LSA)
- Sentiment Analysis
- Term selection
- Time series analysis
- Time series descriptive statistics
- Time series transformation
- Smoothing for time series
- ARIMA
- Mann-Kendall trend tests
- Cointegration test
- Unit root and stationarity tests
- Homogeneity tests for time series
- Heteroscedasticity tests
- Durbin-Watson test
- Cochrane-Orcutt model
- Fourier transform
- Spectral analysis
- Times series visualization
- Machine Learning
- Extreme gradient boosting
- Monte Carlo simulations
(only for Windows OS)
- Statistical process control
- Individual charts
- Subgroup charts
- Attribute charts
- Time weighted charts
- Pareto charts
- Gage repeatability and reproducibility (quantitative)
- Gage repeatability and reproducibility for attributes
- XLSTAT.ai
- Easy Fit / Easy Predict
無料トライアルについて
トライアルでは、最上位グレード XLSTAT Advanced に加え、3D Plot と LatentClass のオプションもご利用いただけます。
*XLSTATの開発元LUMIVERO社ウェブサイトから直接お申込みいただきます。
*トライアルは登録完了日に開始され、有効期間は14日間です。トライアルを更新または延長することはできません。